
Algorithmic Trading
with Markov Decision
Processes
A model-based reinforcement learning approach to stock trading that outperforms naive strategies using RSI-based state classification and value iteration.
Project Overview
This project develops a low-frequency algorithmic trading strategy designed for investment firms with significant market influence. Unlike high-frequency trading, our approach operates on weekly timeframes, making decisions that can meaningfully impact stock prices.
We frame the trading problem as a Markov Decision Process, using the Relative Strength Index (RSI) to classify market states and computing optimal policies through value iteration. The model-based approach leverages historical data from 2000-2020 to construct explicit transition and reward matrices.
Key insight: While model-free methods like Q-learning require massive datasets, stock trading's limited data (~365 points/year) makes model-based approaches more practical and interpretable.
MDP State Space
Technical Approach
State Classification
States derived from RSI (Relative Strength Index), a momentum indicator measuring price change magnitude. Weekly RSI values categorized into three states based on statistical thresholds (mean ± std).
Action Classification
Actions labeled based on deviation from expected closing price using 12-week trend regression. Buy if price exceeds +0.5σ, Sell if below -0.5σ, Hold within ±0.25σ.
Transition Matrix T
Captures P(s'|s,a) — probability of transitioning between states given an action. Built from observed state-action-state frequencies in training data.
Reward Matrix R
Records expected % price change for each state-action pair. Computed as average observed reward for each (state, action) combination.
Value Iteration
Iteratively computes optimal utility U(s) for each state until convergence. Discount factor γ=0.9 balances immediate vs. future rewards.
Policy Extraction
Optimal policy π*(s) extracted by selecting action maximizing expected utility. Results in one of 3³ = 27 possible policies across the three states.
a*(s)
Optimal action for state s
R(s,a)
Expected reward for taking action a in state s
γ = 0.9
Discount factor balancing immediate vs. future rewards
T(s,a,s')
Probability of transitioning to s' after taking a in s
U(s')
Utility of transitioning to state s'
Σs'
Sum over all possible successor states
Results & Analysis
NVDA (NVIDIA)
Optimal = Best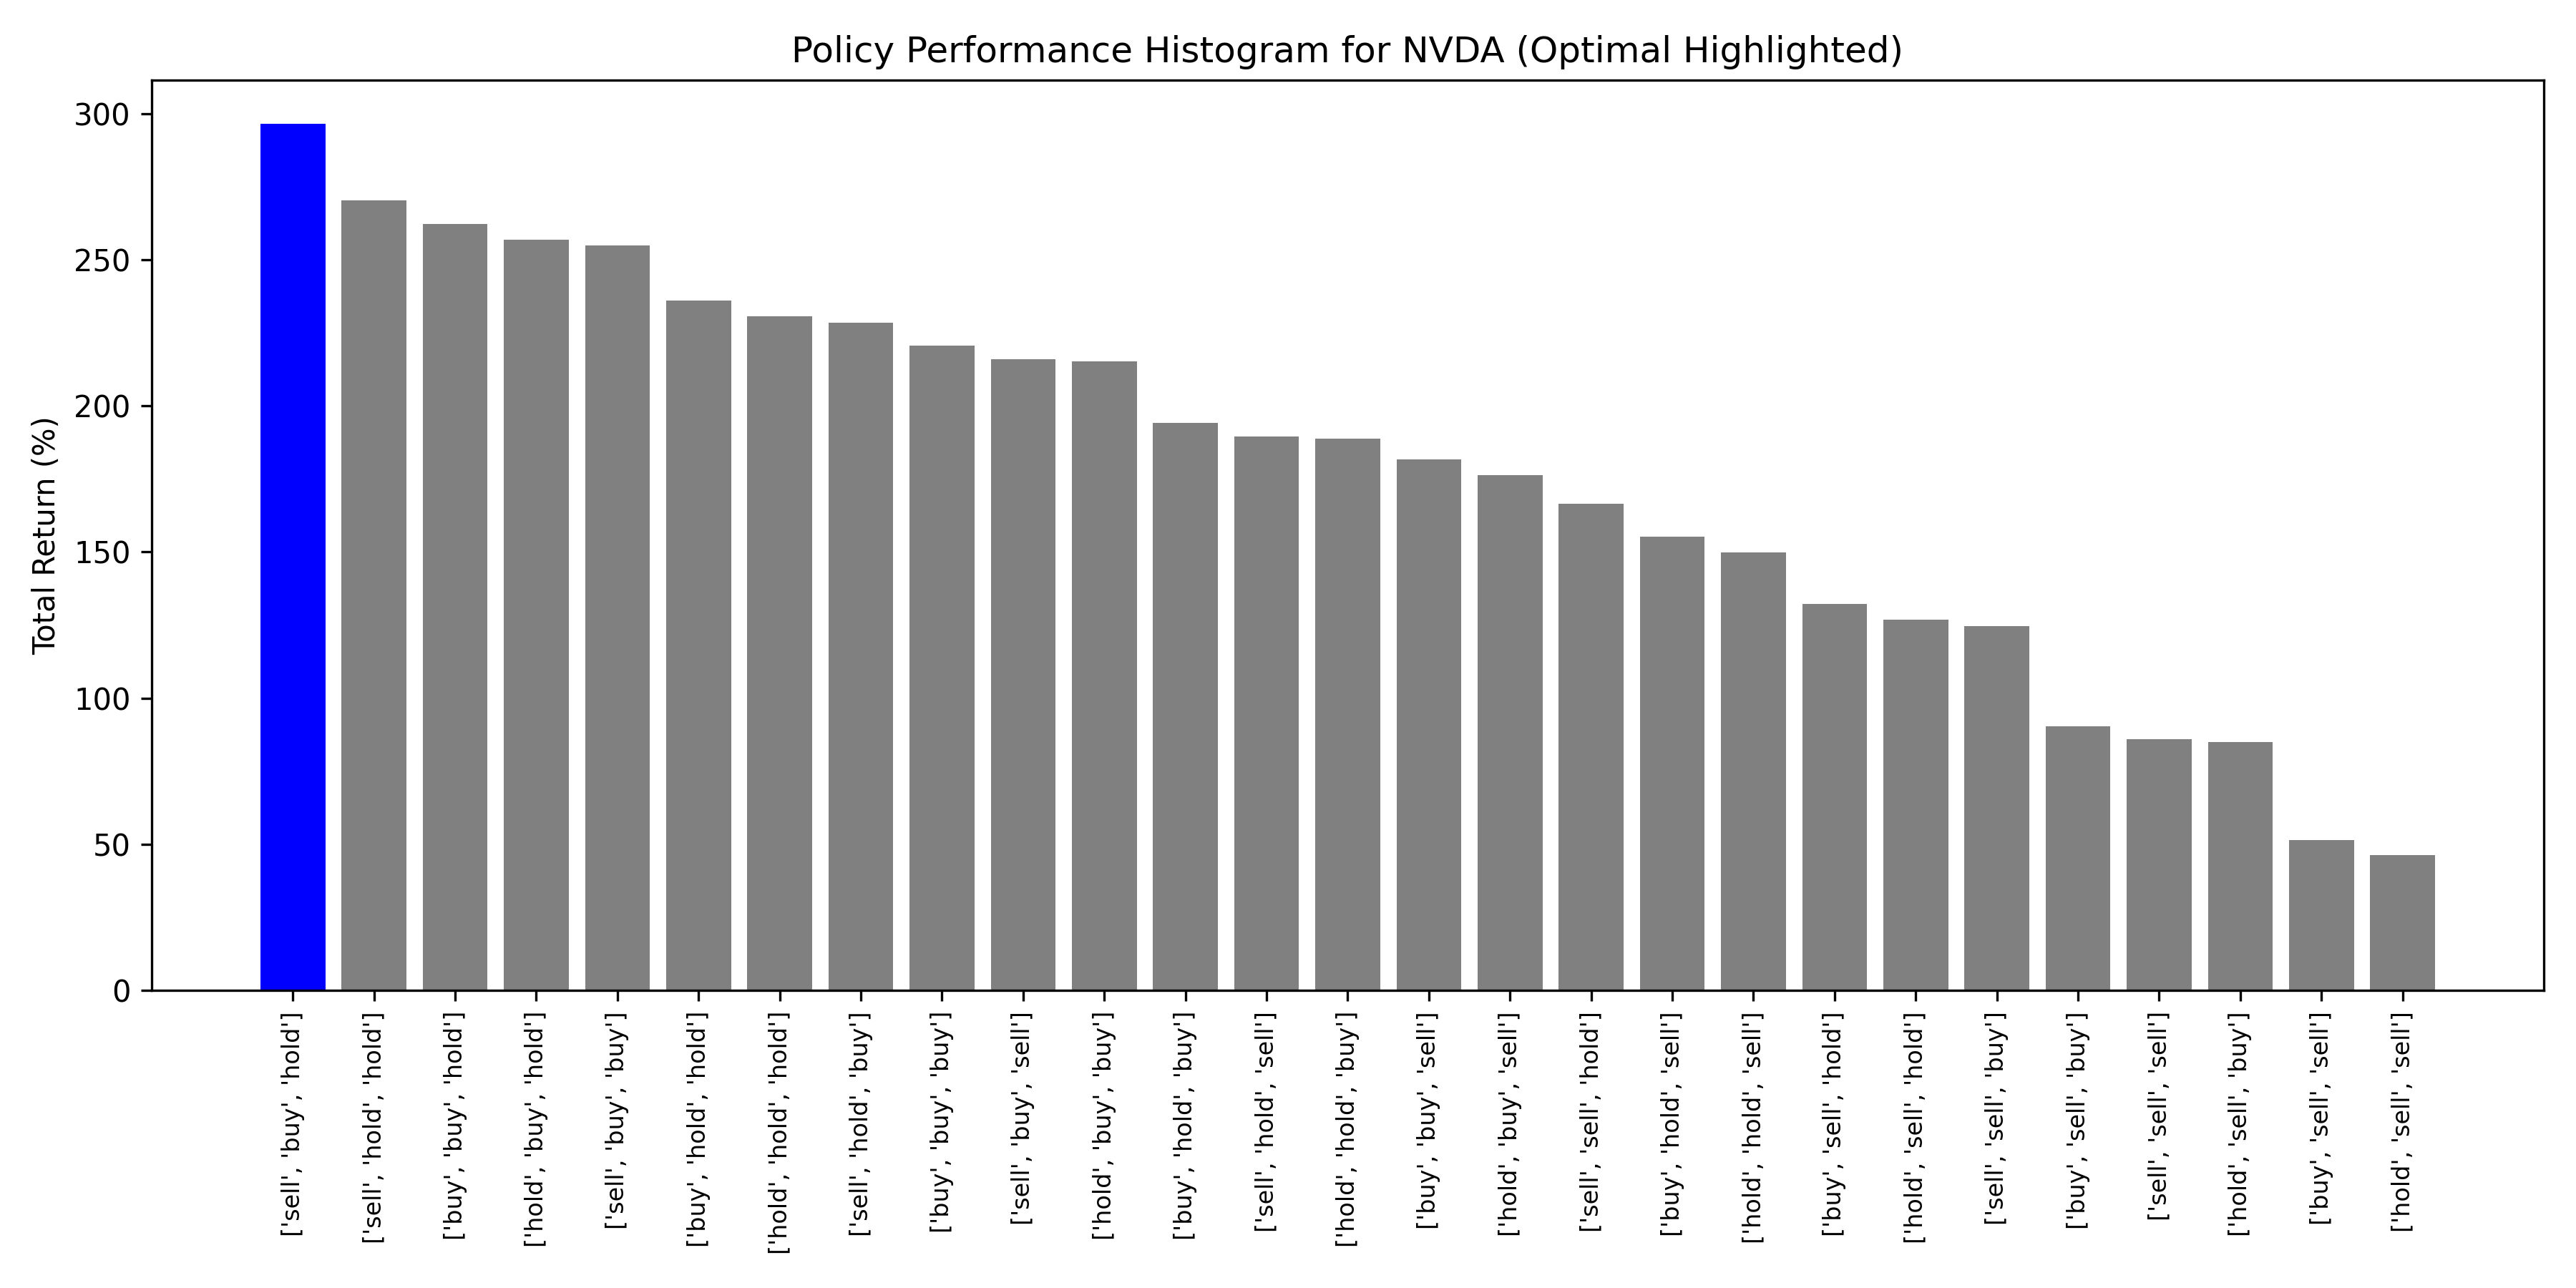
JNJ (Johnson & Johnson)
Optimal Underperformed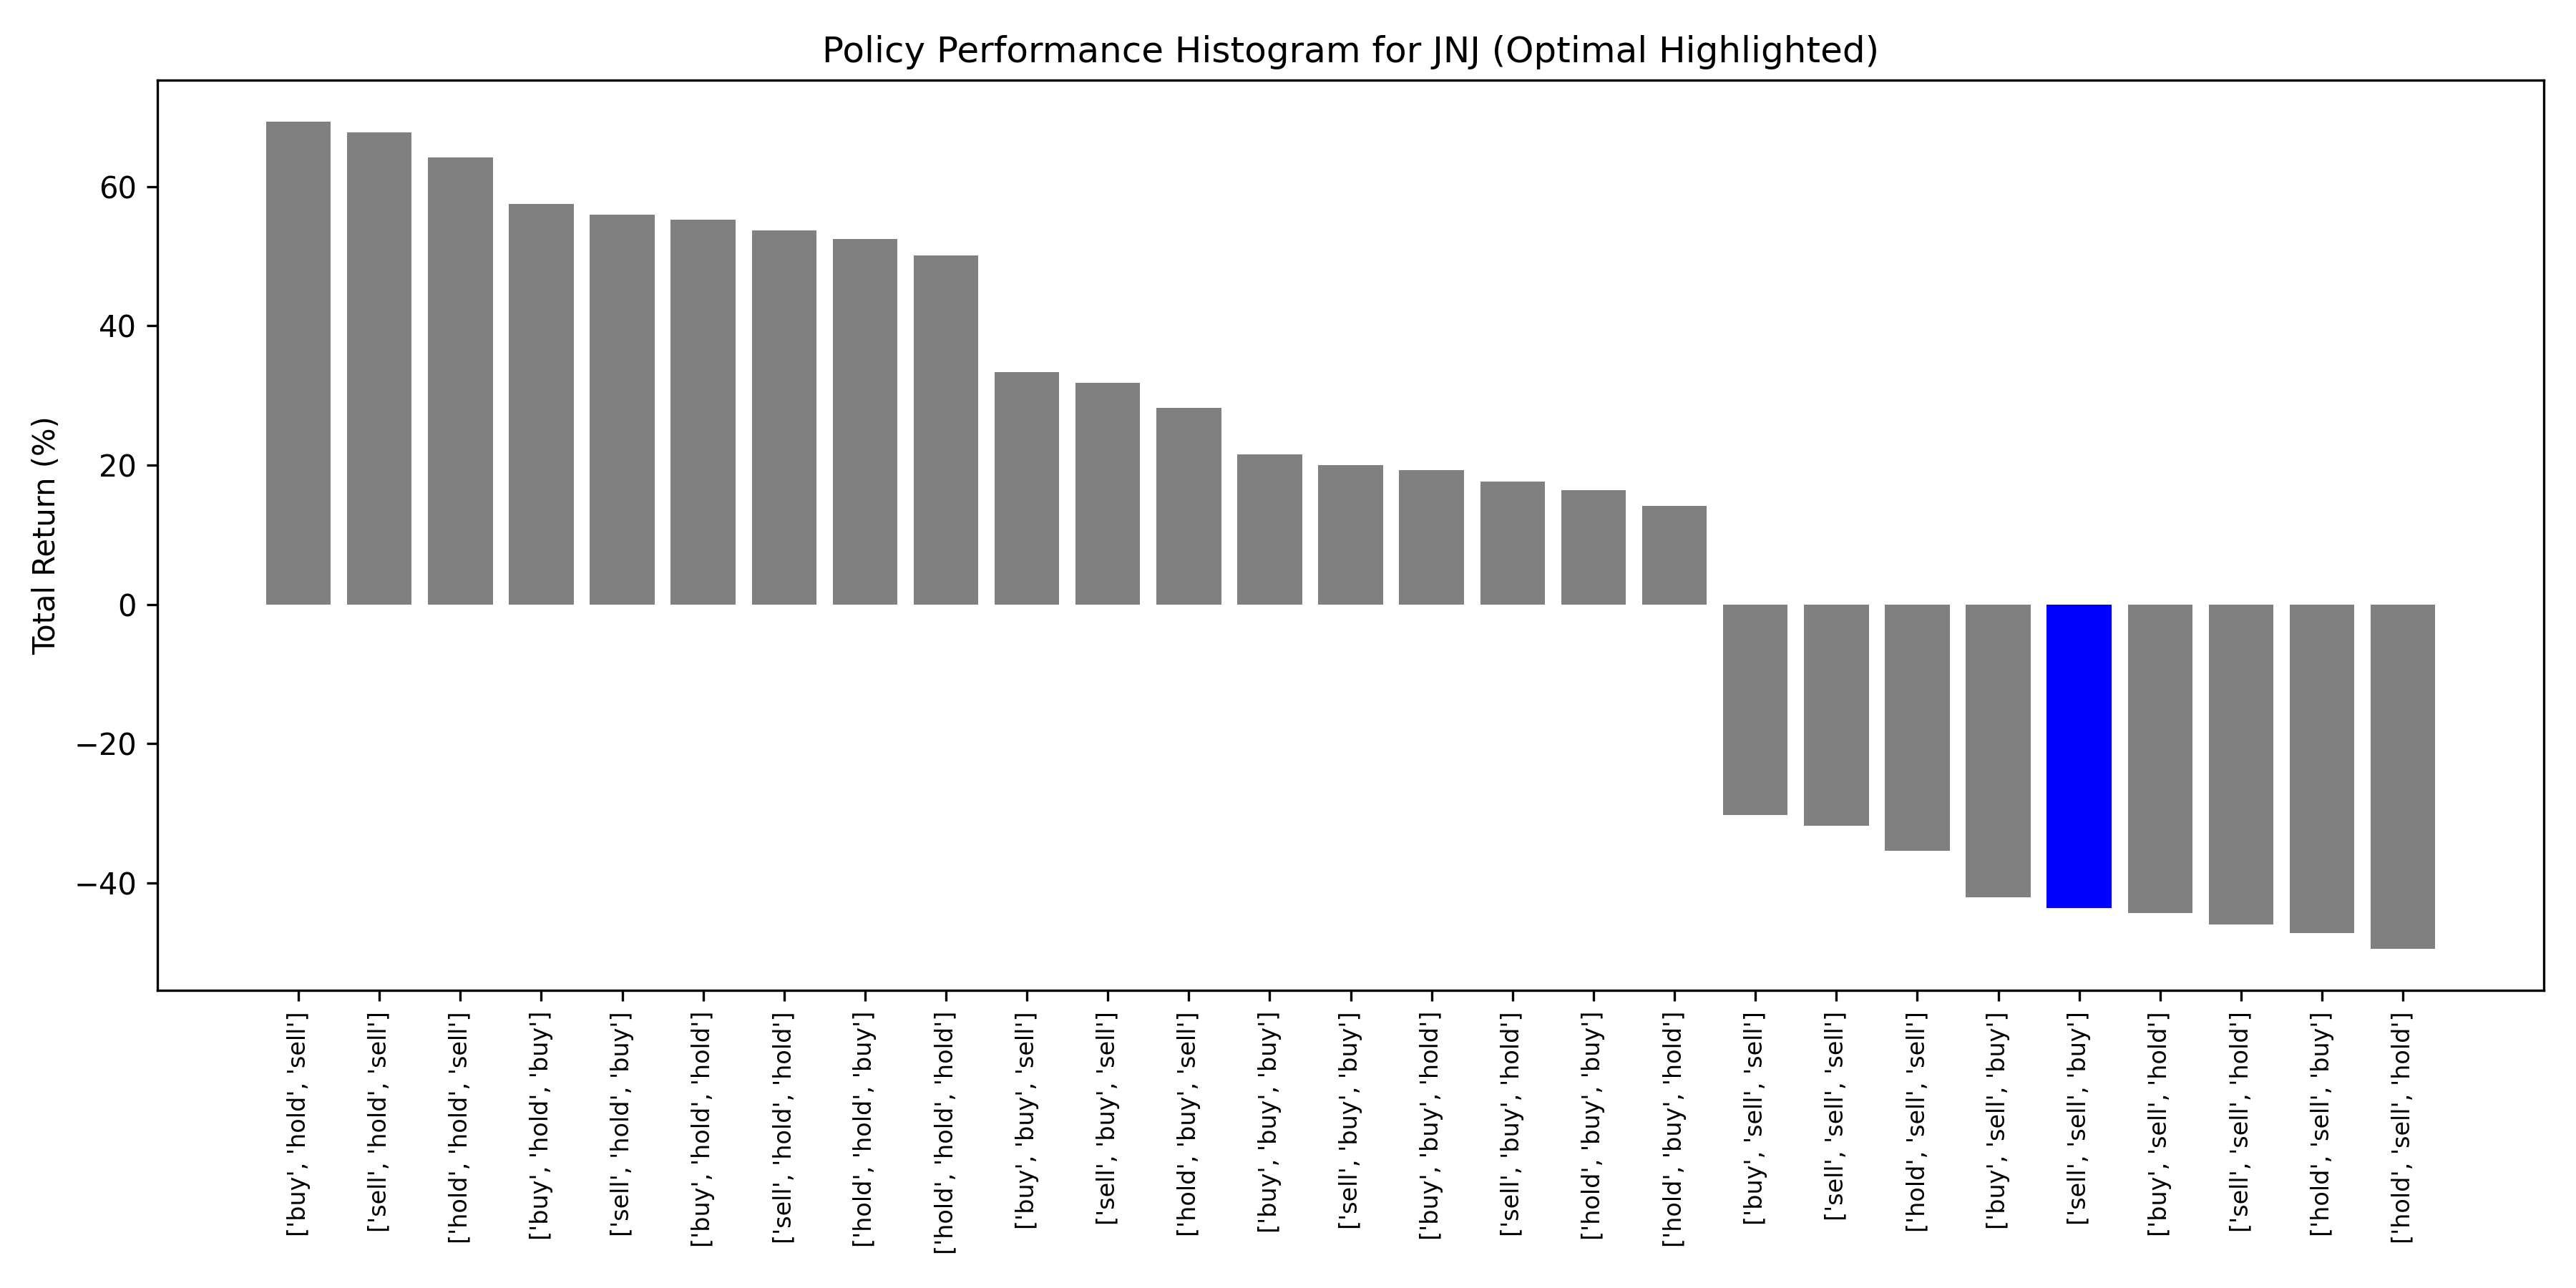
Aggregate Performance: Top 20 Stocks by Market Cap
Normalized returns averaged across AAPL, MSFT, GOOGL, AMZN, NVDA, TSLA, META, and 13 others
✓ Momentum-Driven Stocks
High-volatility, momentum-driven stocks (NVDA, TSLA) showed strongest performance under optimal policy. RSI-based state classification captures short-term sentiment effectively for speculative assets.
✓ Aggregate Outperformance
Optimal policy ranked #1 across all 27 possible policies when averaged over 20 stocks, validating the model-based approach for portfolio-level decision making.
⚠ Stable Stock Limitations
Low-volatility stocks (JNJ, PG) showed weak or negative returns under optimal policy. Prices driven by fundamentals rather than momentum—RSI less predictive.
⚠ Data Constraints
Limited historical data (~1000 weekly observations) constrains transition matrix accuracy. COVID-era data excluded to avoid anomalous patterns.